There are several factors that influence the cost of parking structures beyond the obvious costs of labor and material that contribute to the total cost. One example is the geographic location of the construction site and the premium costs associated with union scale erection vs. open shop. Another example is the level of attention given to aesthetic presentation in prominent, up-scale localities. Features such as the use of thin brick, form liners, extensive glazing in stair and elevator towers, along with other architectural features such as bullnoses and eyebrows are all subjective choices that carry a premium cost.
One often overlooked metric is parking efficiency as measured in terms of parking stall density. This narrative is intended to give owners and architects a “high altitude” perspective of how the selection of the parking structure’s footprint is a major influencer affecting parking efficiency, and by implication, the overall cost of the parking structure. To do so, we will look at four (4) examples of parking efficiency base solely upon the structural footprint. At the outset, a long-use rule-of-thumb is that the closer the parking efficiency approaches a density of 300-310 s.f./space the more highly efficient it becomes.
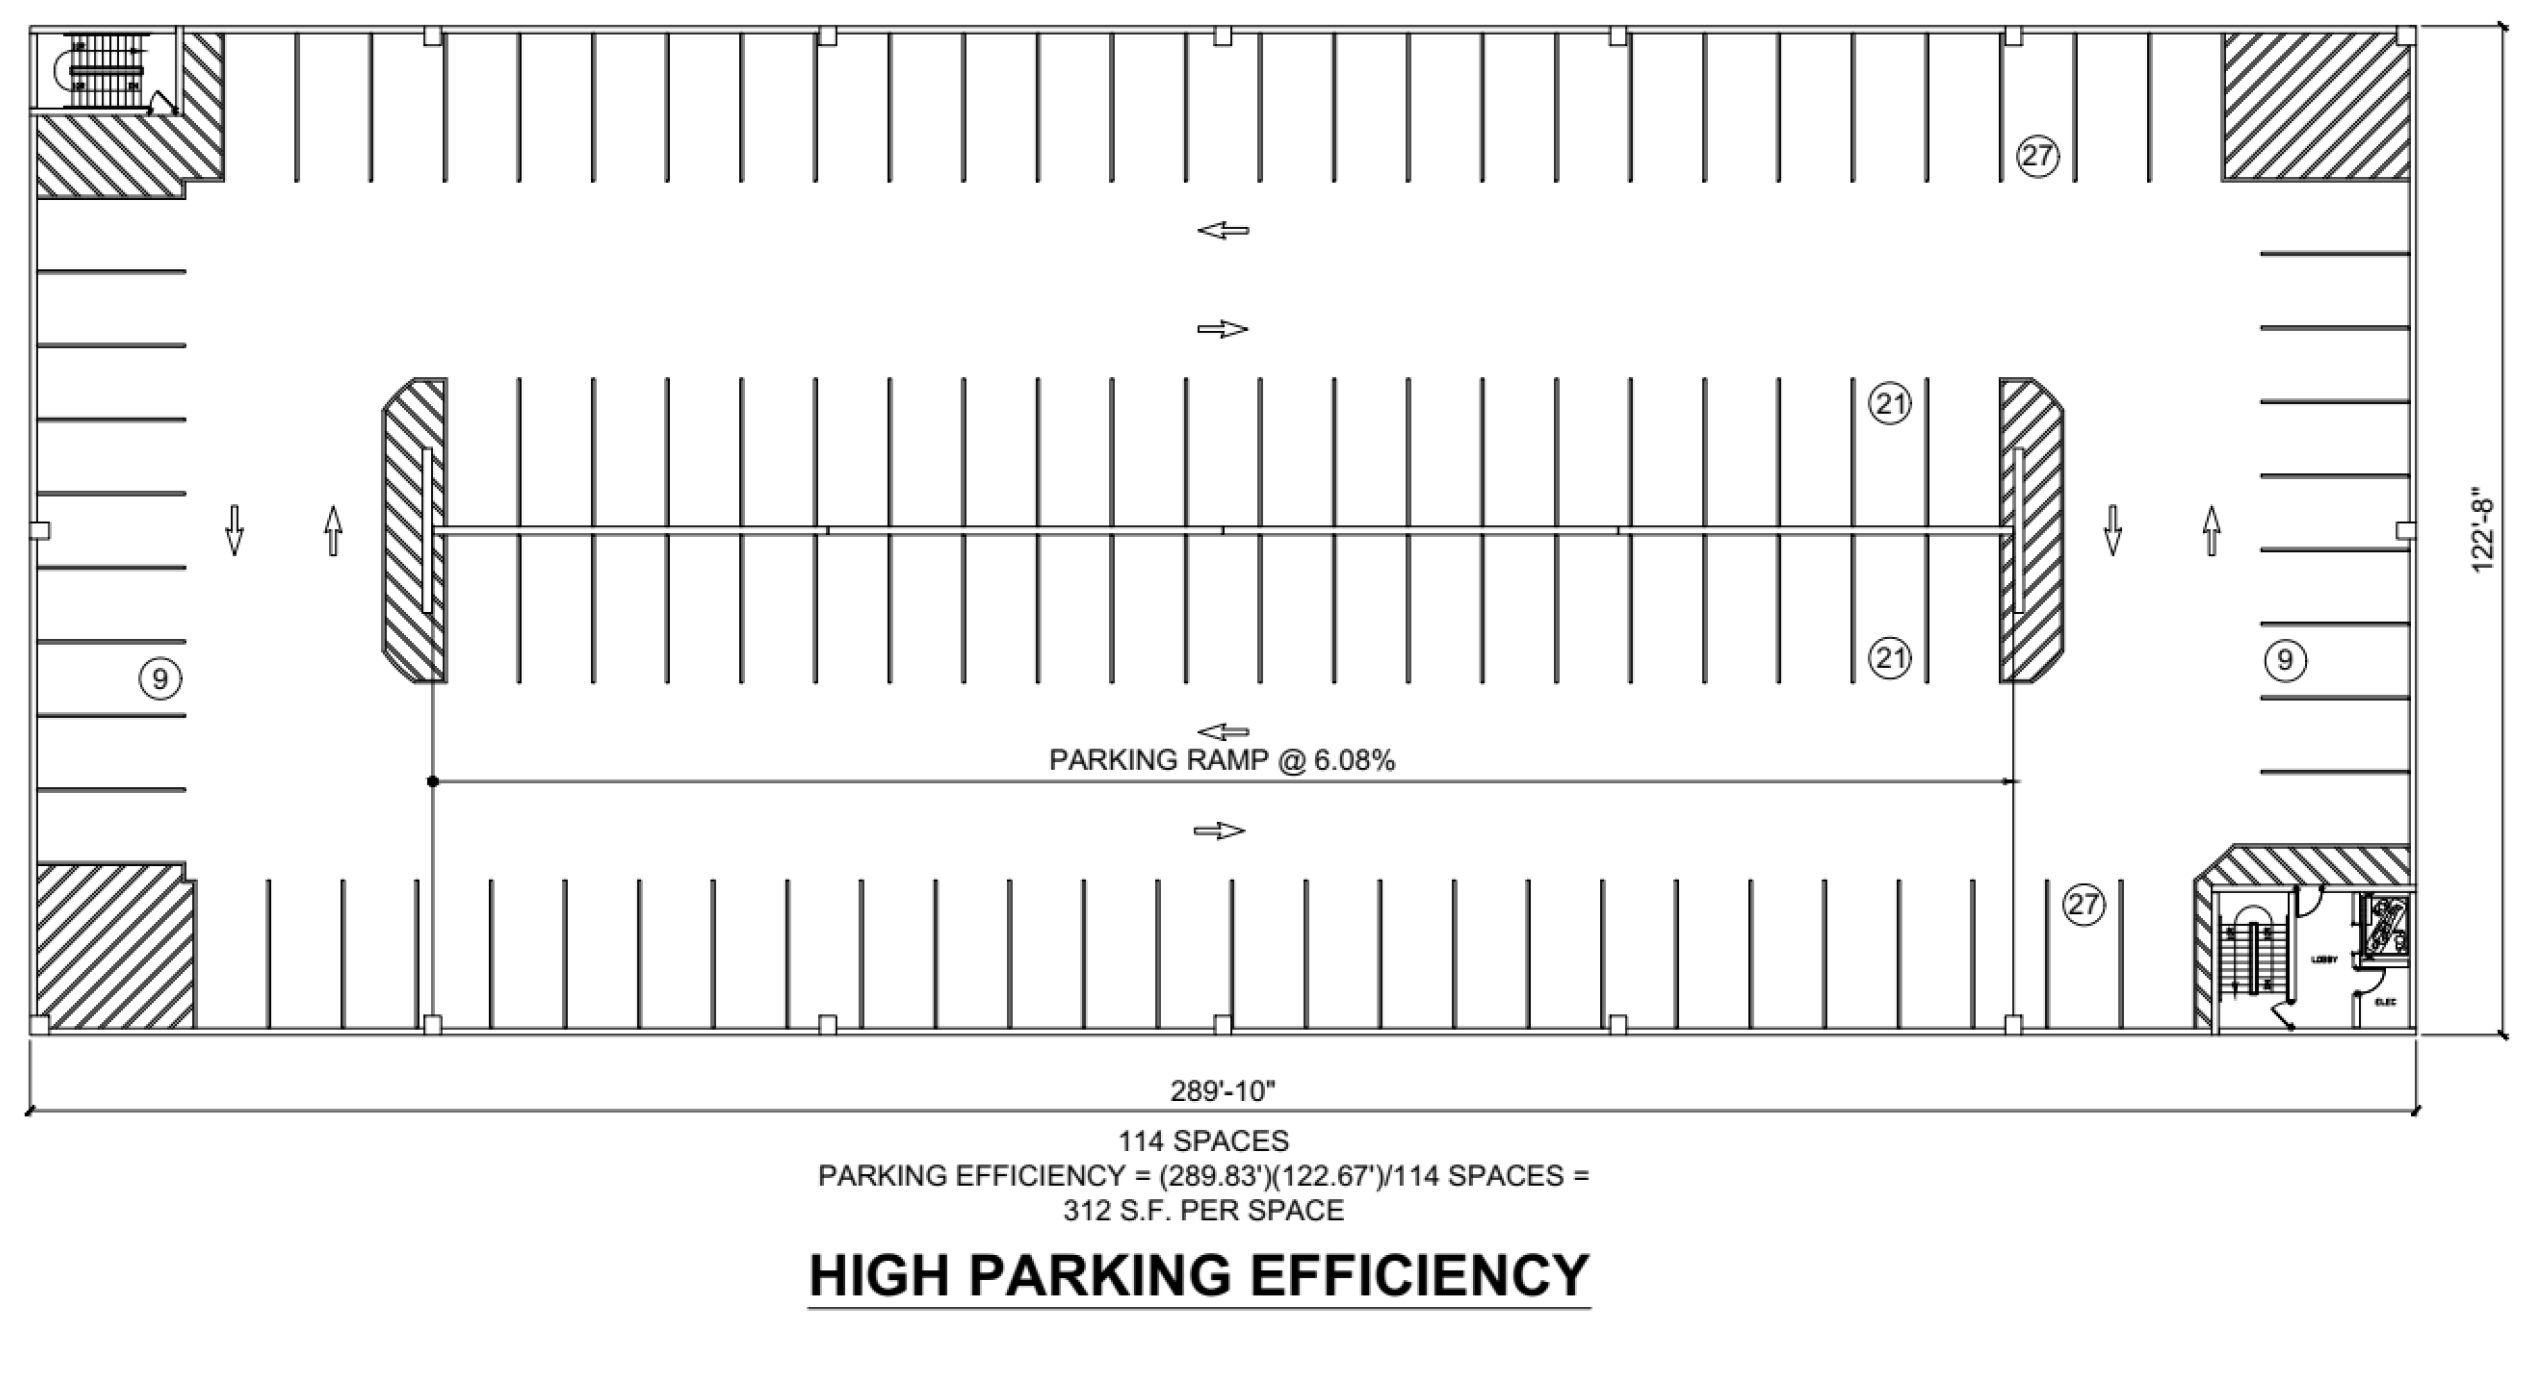
Examples of High Parking Efficiency
The first example shown below is of a high efficiency parking structure. The footprint is 35,553 s.f., and approaches a recommended maximum length of 300’-0” before introducing an expansion joint. Assuming a story height of 11’-8” a single parking ramp keeps within the IBC-prescribed maximum gradient of 6.67%. Over 60% of the parking spaces are on “flat” parking surfaces, thus achieving a higher Level of Service (LOS) for the comfort of parking patrons. End bay parking is utilized and is usually seen as a method of improving parking density. The parking efficiency is calculated as 312 s.f./space.
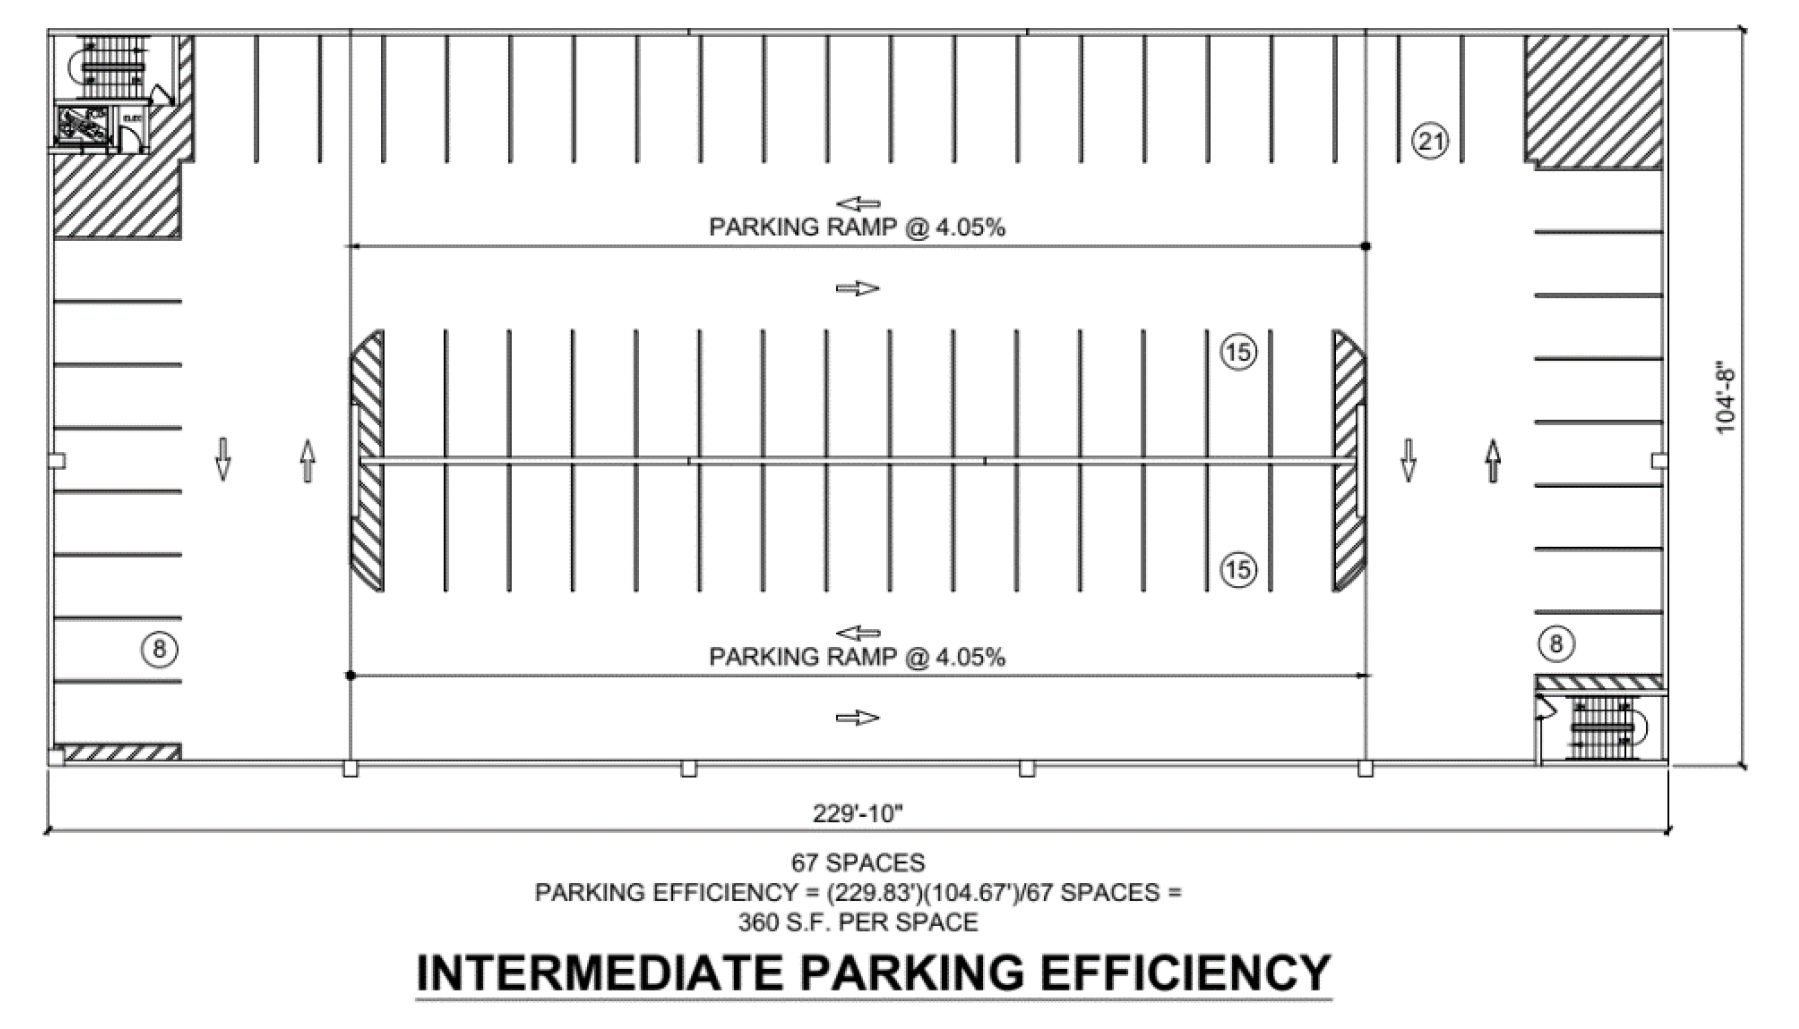
Example Of Intermediate Parking Efficiency
The second example shown below is of an intermediate efficiency parking structure. The footprint is 24,057 s.f., and its overall length has been reduced. In this example the footprint was chosen because of limited availability on site, resulting in limiting the parking in the bottom parking bay to single-loading on one side of the drive aisle in lieu of the much more commonly used double-loading scheme. Assuming a story height of 11’-8” the double-parking ramps keep within the IBC-prescribed maximum gradient of 6.67%. Only about 40% of the parking spaces are on “flat” parking surfaces, thus reducing the Level of Service (LOS), which is not uncommon in many functioning parking structures. End bay parking is utilized and is usually seen as a method of improving parking density. The parking efficiency is calculated as 360 s.f./space.
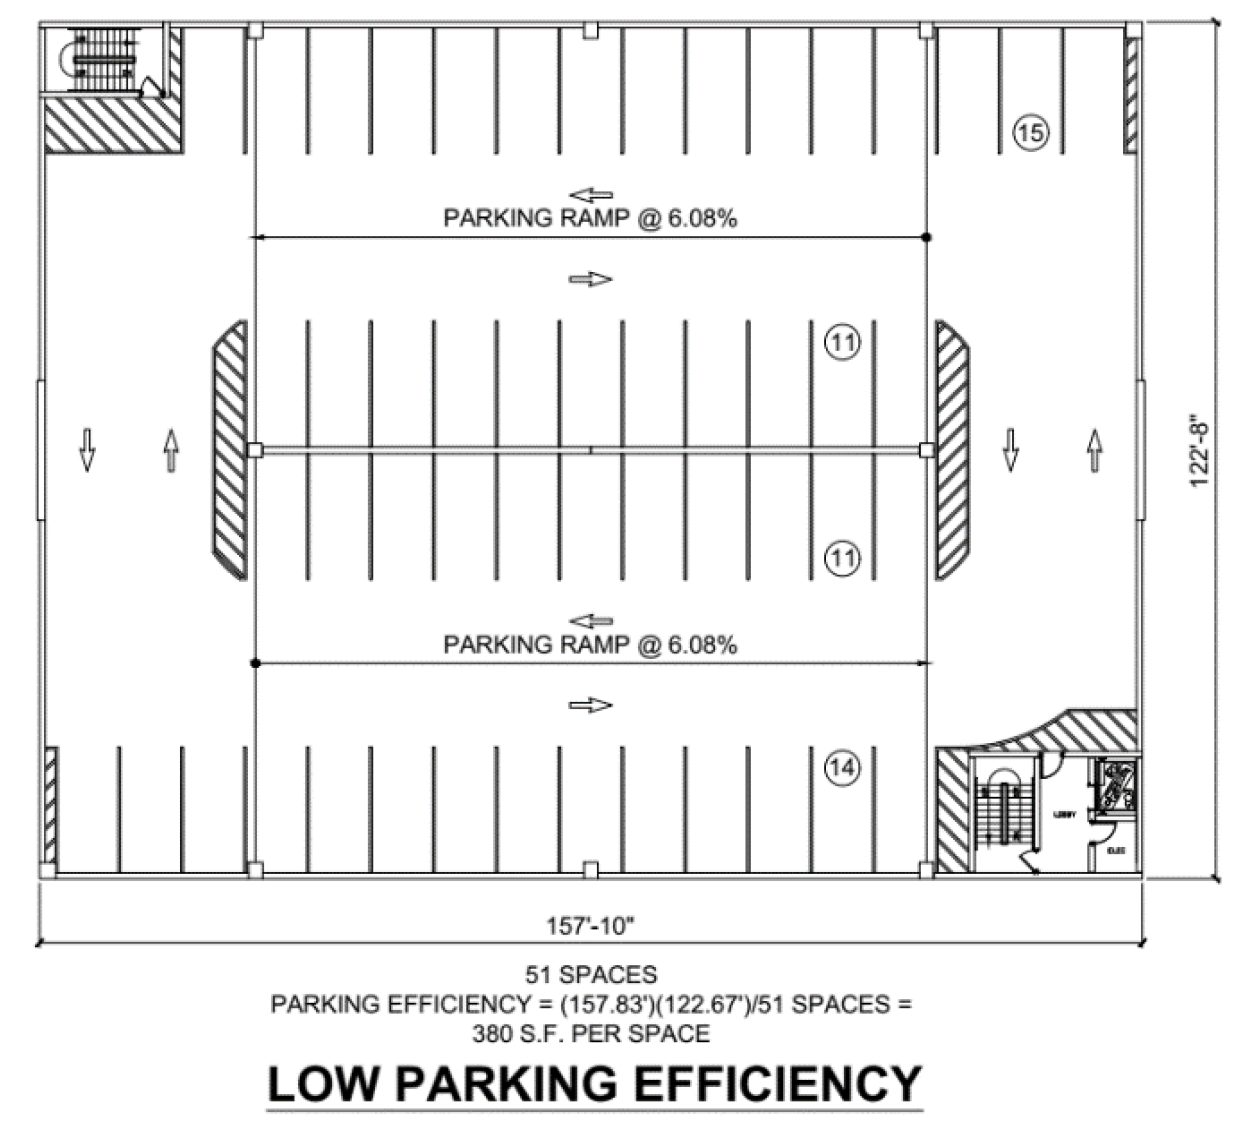
Example Of Low Parking Efficiency
The third example shown below is of a low efficiency parking structure. The footprint is 19,360 s.f., and its overall length has been greatly reduced. In this example the footprint was chosen because of limited availability on site, but fortunately the structure has enough available width for the bottom parking bay to utilize a double-loading scheme. Assuming a story height of 11’-8” the double-parking ramps keep within the IBC-prescribed maximum gradient of 6.67%. Only about 14% of the parking spaces are on “flat” parking surfaces, thus reducing the Level of Service (LOS) even further. End bay parking is not able to be utilized, so the resulting parking efficiency is calculated as 380 s.f./space.
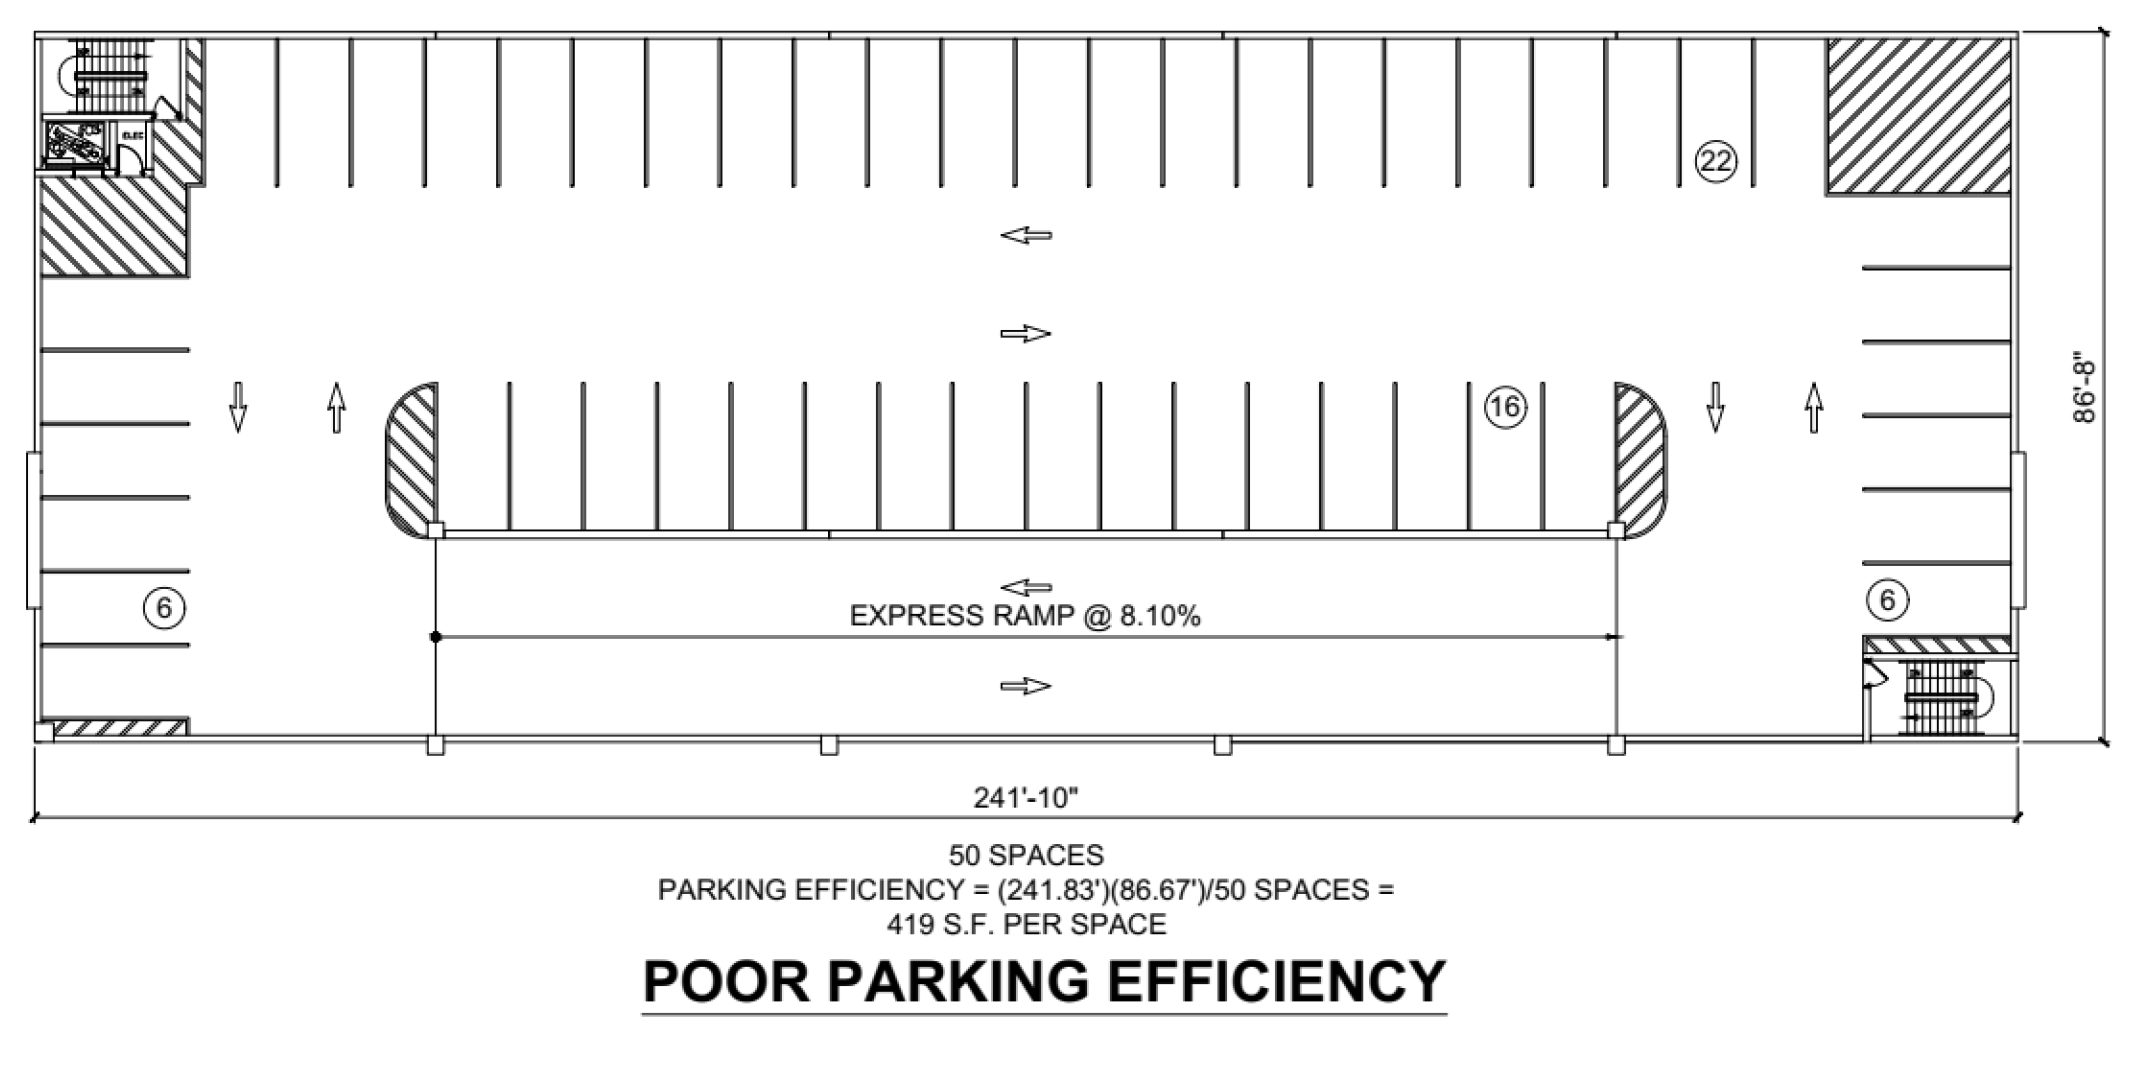
Example Of Poor Parking Efficiency
The fourth and final example shown below is of a poor efficiency parking structure. The footprint is 20,959 s.f., and its overall width has been greatly reduced. In this example the footprint was chosen because of limited availability on site, so the bottom bay is unable to be used for parking, instead utilizing an express ramp to access each level. The good news is that 100% of the parking spaces are on “flat” parking surfaces, thus greatly improving the Level of Service (LOS), but at the expense of creating a very disproportionate ratio of driving surface to parking surface. Even though end bay parking is utilized it has very little influence on the disproportionate surface areas. The resulting parking efficiency is calculated as 419 s.f./space.
So, what is the primary take-away from these four (4) simple comparisons? Assuming that space is not severely limited by the utilization of the rest of the site for adjoining structures such as a residential wrap, the best “bang for the buck” is to approach a parking structure footprint like that of Example 1 above. Let’s quantify this with the following comparisons.
Assume there are few space limitations available for the parking structure footprint and assume the targeted number of parking spaces is 570 spaces. Because it is the most efficient, Example 1 will serve as the benchmark for comparative purposes. Discounting the spaces sacrificed at the entrances, ADA vehicular parking, and unfinished space under a portion of the ground level parking ramp due to insufficient headroom, the four (4) examples above compare as follows…
Example 1:
- The number of levels (including the surface level) = 570 spaces / 114 spaces per level = 5.0
- The total parking area (including the surface level) = (5 levels)(35,553 s.f./level) = 177,765 s.f.
Example 2:
- The number of levels (including the surface level) = 570 spaces / 67 spaces per level = 8.5
- The total parking area (including the surface level) = (8.5 levels)(24,057 s.f./level) = 204,485 s.f.
- Example 2 will cost a rough order of magnitude of 204,485 s.f. / 177,765 s.f. = 15% more than Example 1.
Example 3:
- The number of levels (including the surface level) = 570 spaces / 51 spaces per level = 11.2
- The total parking area (including the surface level) = (11.2 levels)(19,360 s.f./level) = 216,832 s.f.
- Example 3 will cost a rough order of magnitude of 216,832 s.f. / 177,765 s.f. = 22% more than Example 1.
Example 4:
- The number of levels (including the surface level) = 570 spaces / 50 spaces per level = 11.4
- The total parking area (including the surface level) = (11.4 levels)(20,959 s.f./level) = 238,933 s.f.
- Example 4 will cost a rough order of magnitude of 238,933 s.f. / 177,765 s.f. = 34% more than Example 1.
In conclusion, the following approximations can serve as a rough guide for preliminary size planning for a variety of parking structure footprints. These approximations account for the spaces sacrificed at the entrances, ADA vehicular parking, and the unfinished space under a portion of the ground level parking ramp due to insufficient headroom.
|
Stories |
Elevated Levels |
Structure Footprint |
Area / Level (Gross) | Parking Area (Net) |
Estimated Parking |
Parking Efficiency |
| 5 | 4 | 122’-8” x 145’-10” | 17,889 s.f. | 72,165 s.f. | 180 Spaces | 400 s.f./space |
| 5 | 4 | 122’-8” x 157’-10” | 19,361 s.f. | 79,525 s.f. | 199 Spaces | 400 s.f./space |
| 5 | 4 | 122’-8” x 169’-10” | 20,833 s.f. | 86,885 s.f. | 217 Spaces | 400 s.f./space |
| 5 | 4 | 122’-8” x 181’-10” | 22,305 s.f. | 94,245 s.f. | 236 Spaces | 400 s.f./space |
| 5 | 4 | 122’-8” x 193’-10” | 23,777 s.f. | 101,606 s.f. | 267 Spaces | 380 s.f./space |
| 5 | 4 | 122’-8” x 205’-10” | 25,249 s.f. | 108,966 s.f. | 287 Spaces |
380 s.f./space |
| 5 | 4 | 122’-8” x 217’-10” | 26,721 s.f. | 116,326 s.f. | 306 Spaces | 380 s.f./space |
| 5 | 4 | 122’-8” x 229’-10” | 28,183 s.f. | 123,686 s.f. | 344 Spaces | 360 s.f./space |
| 5 | 4 | 122’-8” x 241’-10” | 29,665 s.f. | 139,686 s.f. | 388 Spaces | 360 s.f./space |
| 5 | 4 | 122’-8” x 253’-10” | 31,137 s.f. | 147,047 s.f. | 460 Spaces | 320 s.f./space |
| 5 | 4 | 122’-8” x 265’-10” | 32,609 s.f. | 154,407 s.f. | 483 Spaces | 320 s.f./space |
| 5 | 4 | 122’-8” x 277’-10” | 34,081 s.f. | 161,767 s.f. | 506 Spaces | 320 s.f./space |
| 5 | 4 | 122’-8” x 289’-10” | 35,553 s.f. | 169,127 s.f. | 537 Spaces | 315 s.f./space |
| 5 | 4 | 122’-8” x 301’-10” | 37,025 s.f. | 176,487 s.f. | 560 Spaces | 315 s.f./space |
| 5 | 4 | 183’-8” x 145’-10” | 26,785 s.f. | 116,643 s.f. | 307 Spaces | 380 s.f./space |
| 5 | 4 | 183’-8” x 157’-10” | 28,989 s.f. | 127,663 s.f. | 355 Spaces | 360 s.f./space |
| 5 | 4 | 183’-8” x 169’-10” | 31,193 s.f. | 138,683 s.f. | 385 Spaces | 360 s.f./space |
| 5 | 4 | 183’-8” x 181’-10” | 33,397 s.f. | 149,704 s.f. | 468 Spaces | 320 s.f./space |
| 5 | 4 | 183’-8” x 193’-10” | 35,601 s.f. | 160,724 s.f. | 502 Spaces | 320 s.f./space |
| 5 | 4 | 183’-8” x 205’-10” | 37,805 s.f. | 171,744 s.f. | 545 Spaces | 315 s.f./space |
| 5 | 4 | 183’-8” x 217’-10” | 40,009 s.f. | 182,764 s.f. | 580 Spaces | 315 s.f./space |
| 5 | 4 | 183’-8” x 229’-10” | 42,213 s.f. | 193,784 s.f. | 615 Spaces | 315 s.f./space |
| 5 | 4 | 183’-8” x 241’-10” | 44,417 s.f. | 213,445 s.f. | 678 Spaces | 315 s.f./space |
| 5 | 4 | 183’-8” x 253’-10” | 46,621 s.f. | 224,465 s.f. | 713 Spaces | 315 s.f./space |
| 5 | 4 | 183’-8” x 265’-10” | 48,825 s.f. | 235,485 s.f. | 748 Spaces | 315 s.f./space |
| 5 | 4 | 183’-8” x 277’-10” | 51,029 s.f. | 246,505 s.f. | 783 Spaces | 315 s.f./space |
| 5 | 4 | 183’-8” x 289’-10” | 53,233 s.f. | 257,525 s.f. | 858 Spaces | 300 s.f./space |
| 5 | 4 | 183’-8” x 301’-10” | 55,437 s.f. | 268,546 s.f. | 895 Spaces | 300 s.f./space |
Nitterhouse Concrete Products, Inc. (NCP) in Chambersburg, PA, is a family-owned company serving the construction industry since 1923. Give us a call at 717-267-4505 or visit our website at www.nitterhouseconcrete.com for information on more quality precast, prestressed products to meet your design and construction needs. Choose with confidence and make NCP your single source for precast – what you need when you need it.